EAF–LF Off-Gas Duct Elbow
A combined CFD and structural feasibility study of a DN1600 duct elbow for primary EAF-LF off-gas ductwork at Dejpod Sanaat Sazeh, carried from CAD geometry and a mesh-verified flow prediction through to a structural safety case built on the CFD's own resolved pressure field.
Objective
Dejpod Sanaat Sazeh designs and delivers dust-collection and fume-treatment systems for the steel, iron-making and mining sectors. This internship project set out to build and prove a combined CFD/FEA workflow for the company's duct systems, using one representative EAF-LF off-gas duct section as the case.
- 1Define the problem and choose the analysis approach explicitly, rather than by default assumption.
- 2Fix a complete, traceable design basis for the duct section, anchored to a real reference plant.
- 3Run a mesh-independence-checked CFD analysis of the section’s aerodynamics.
- 4Run a structural (FEA) analysis of the elbow under both an idealized uniform pressure and the CFD’s own resolved wall-pressure field.
- 5Check every stage against independent hand calculation, and close the study out against its own starting specification.
The duct section
The section models one branch of a primary EAF-LF dedusting line: a straight inlet run, a 90-degree long-radius elbow, and a straight outlet run. Flow rate and duct size were derived from a real reference plant rather than assumed, and every value below is traced back to that reference or to a stated engineering assumption.
| Category | Parameter | Value |
|---|---|---|
| Geometry | Nominal internal diameter | 1.60 m |
| Shell wall thickness | 6 mm | |
| Elbow angle / bend radius | 90° / 2.40 m (R = 1.5D) | |
| Upstream / downstream straight length | 5.0 m / 8.0 m | |
| Flow | Design flow rate | 42.50 m³/s |
| Design velocity | 21.1 m/s | |
| Reynolds number | ≈ 9.7 × 10⁵ | |
| Thermal / Structural | Design gas temperature | 200°C |
| Design (suction) pressure | −3.0 kPa | |
| Material | Shell material | S235JR (EN 10025-2) |
| Flange | Outer diameter / bolt-circle diameter | 1.80 m / 1.71 m |
| Bolts | 32 × M20 |
Method: turbulence-model selection
The elbow introduces streamline curvature and a risk of local flow separation on the inner wall. Rather than default to one closure, two candidate RANS turbulence models were compared with a weighted decision matrix, then stress-tested with a sensitivity check on the weights themselves.
| Criterion | Weight | Realizable k-ε | SST k-ω |
|---|---|---|---|
| Accuracy for curvature / separation | 0.30 | 2 | 3 |
| Computational / mesh cost | 0.20 | 3 | 2 |
| Near-wall mesh-targeting robustness | 0.30 | 2 | 3 |
| General solver robustness | 0.20 | 3 | 3 |
| Weighted total | 1.00 | 2.40 | 2.80 |
- SST k-ω selected: better suited to curved, separation-prone flow, and its near-wall treatment adapts across a wide range of mesh resolution instead of needing a narrow y+ window.
- A sensitivity check on the weights confirmed the result is stable. SST k-ω only loses out if raw computational economy is made the dominant priority, which it is not for this study.
- The decision was carried forward without revisiting through the CFD build, run, and verification stages.
- A risk register scored seven technical uncertainties by probability × damage before any modeling began, each with a stated mitigation carried into the analysis.
CFD model: mesh and setup
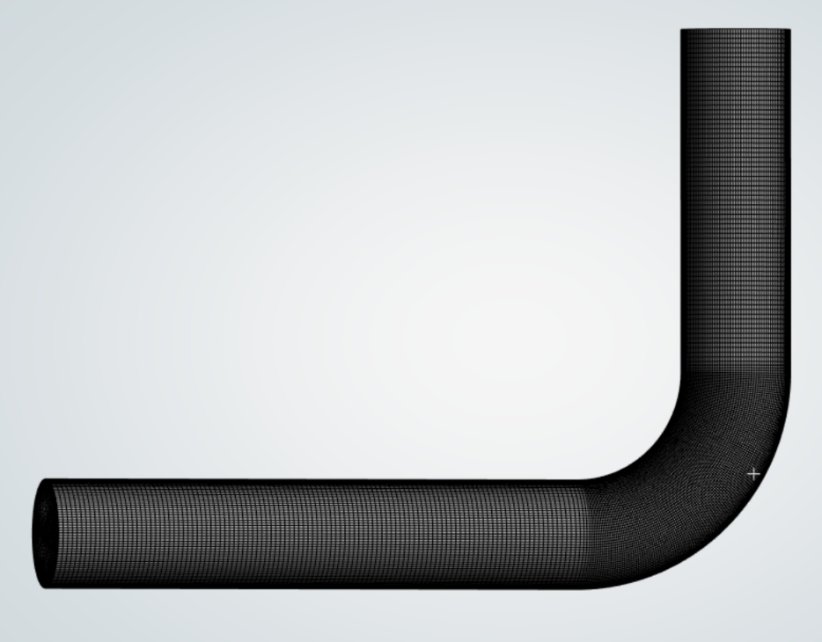
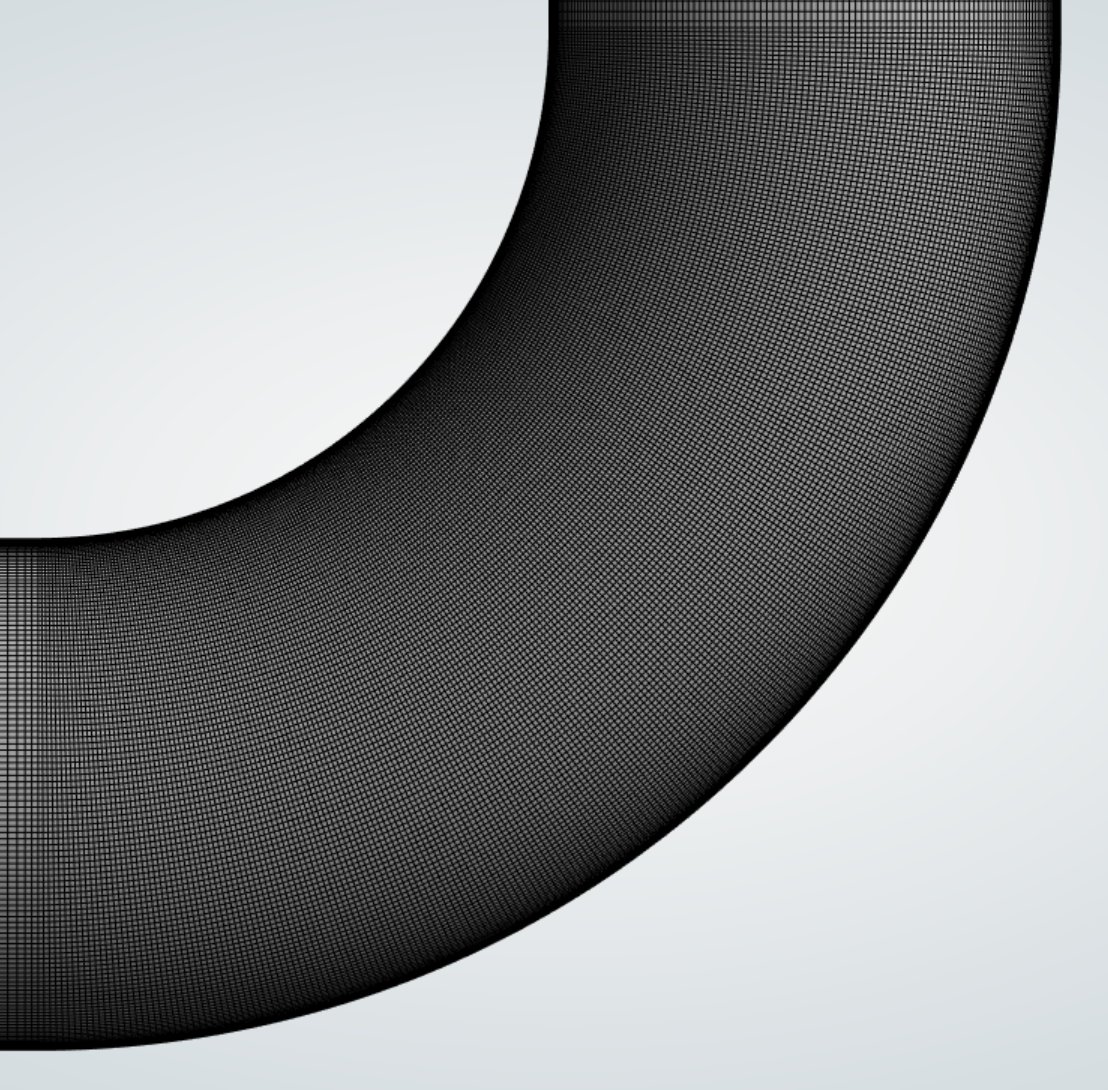
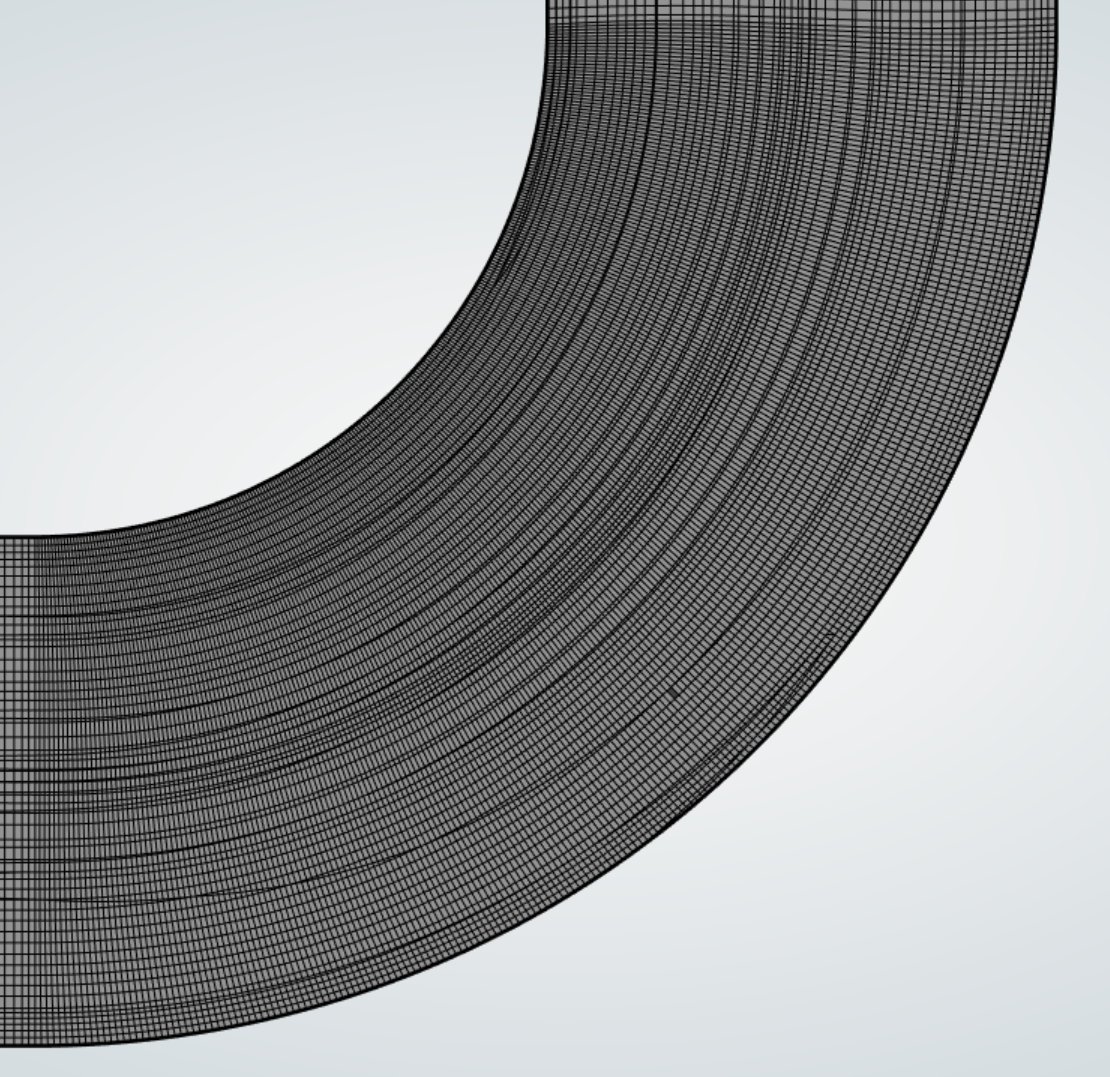
The fluid volume, the space the gas occupies from inlet to outlet, was meshed as a hexahedral O-grid with a boundary-layer inflation targeting a wall y+ near 1, so the near-wall region is resolved directly rather than through a wall function.
| Control | Base mesh | Refined mesh |
|---|---|---|
| Elements | ≈ 1.04 million | ≈ 4.64 million |
| Wall y+ (average) | 0.94 | 1.05 |
| Orthogonal quality (minimum) | 0.57 | 0.83 |
| Skewness (maximum) | 0.44 | 0.44 (unchanged) |
Results: pressure drop and verification
A base mesh and a refined mesh were both run to check the pressure-drop result was not mesh-dependent. Where the CFD and the hand-calculated benchmark disagreed by more than mesh refinement alone could explain, the benchmark itself was audited and found to need a correction, not the CFD.
Pressure drop by mesh state, against the theoretical benchmark
Total pressure drop, inlet to outlet, in Pa. Hover a bar for details.
The hand-calc benchmark needed a correction, not the CFD
The first comparison suggested the CFD was under-predicting pressure drop by a wide margin. Rather than accept that gap, the benchmark itself was audited: its elbow loss coefficient (K = 0.3) had been taken from a generic reference table built around a small, roughly 50 mm reference pipe, about thirty-two times smaller than this 1.6 m duct, and the same reference (Crane TP-410) states its coefficients are diameter-dependent.
Recomputed with Crane’s own diameter-dependent method for this duct’s actual size, the corrected coefficient is K ≈ 0.153, roughly half the original value.
| Quantity | Theory (independent) | CFD result | Status |
|---|---|---|---|
| Near-wall y+ | Target ≈ 1 | 1.045 | Excellent agreement |
| Straight-duct friction | 5.68 Pa | 8.13 Pa | Explainable, developing flow |
| Peak velocity | 25.8 m/s | 28.4 m/s | Consistent, curvature effect |
| Wall shear stress | 0.504 Pa | 1.0–1.3 Pa | Consistent, curvature effect |
| Total pressure drop | 41.7 Pa (corrected) | 39.5 Pa (94.7%) | Good, near mesh-independent |
Flow-field insights
Beyond the pressure-drop number, detailed post-processing shows what is physically happening through the bend, and where that matters for the duct's structural and wear design.
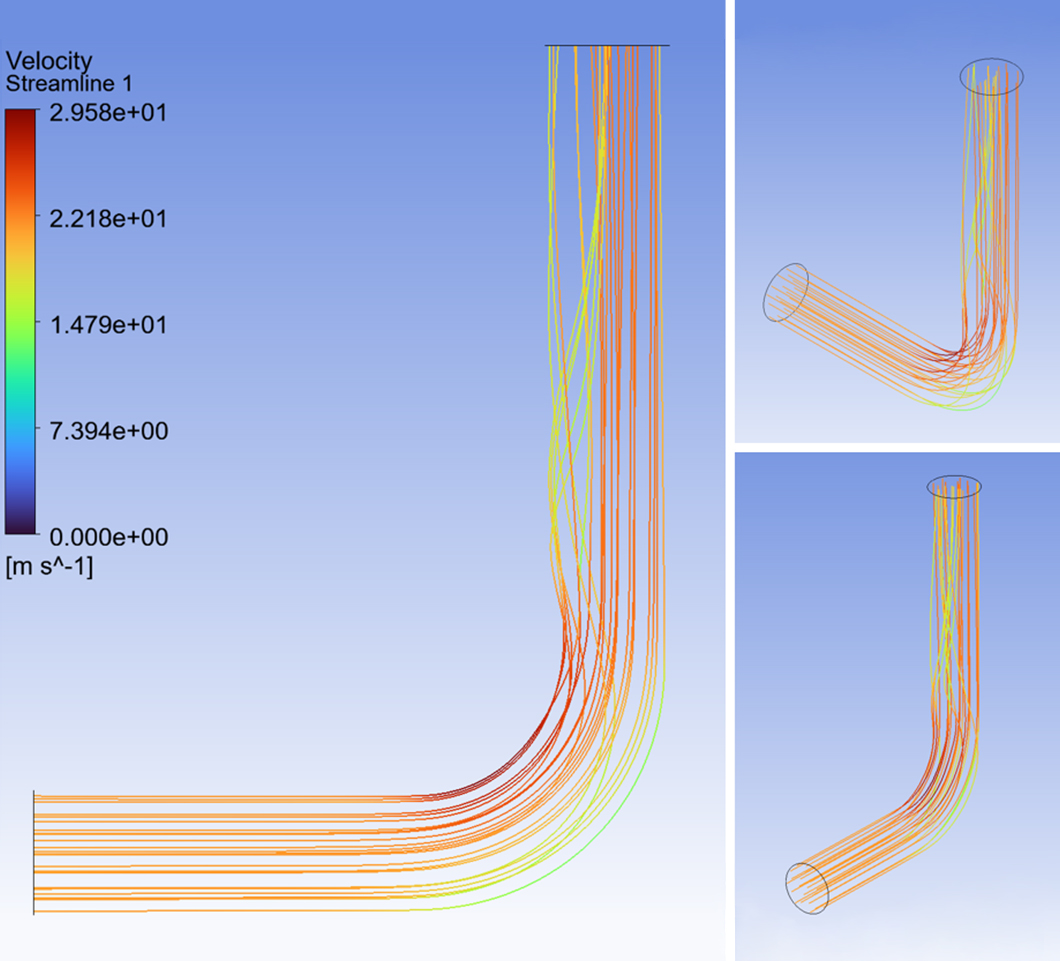
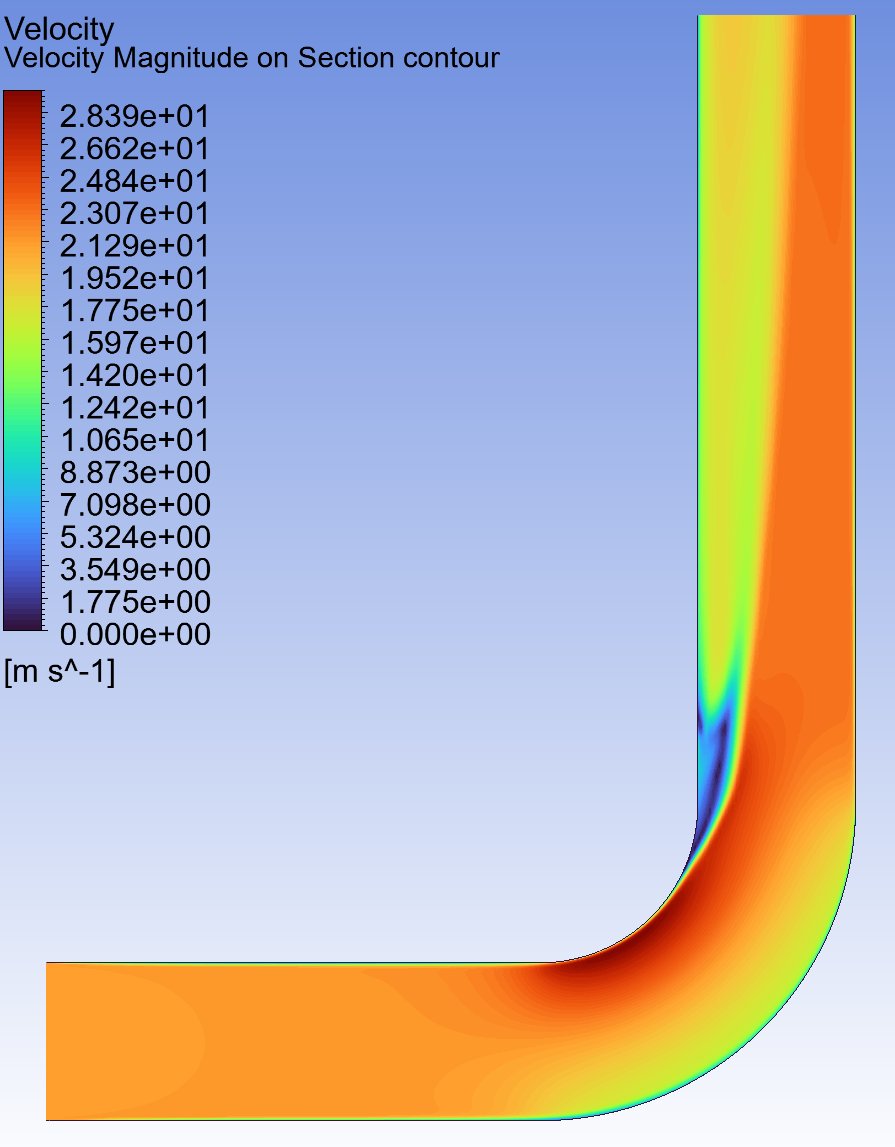
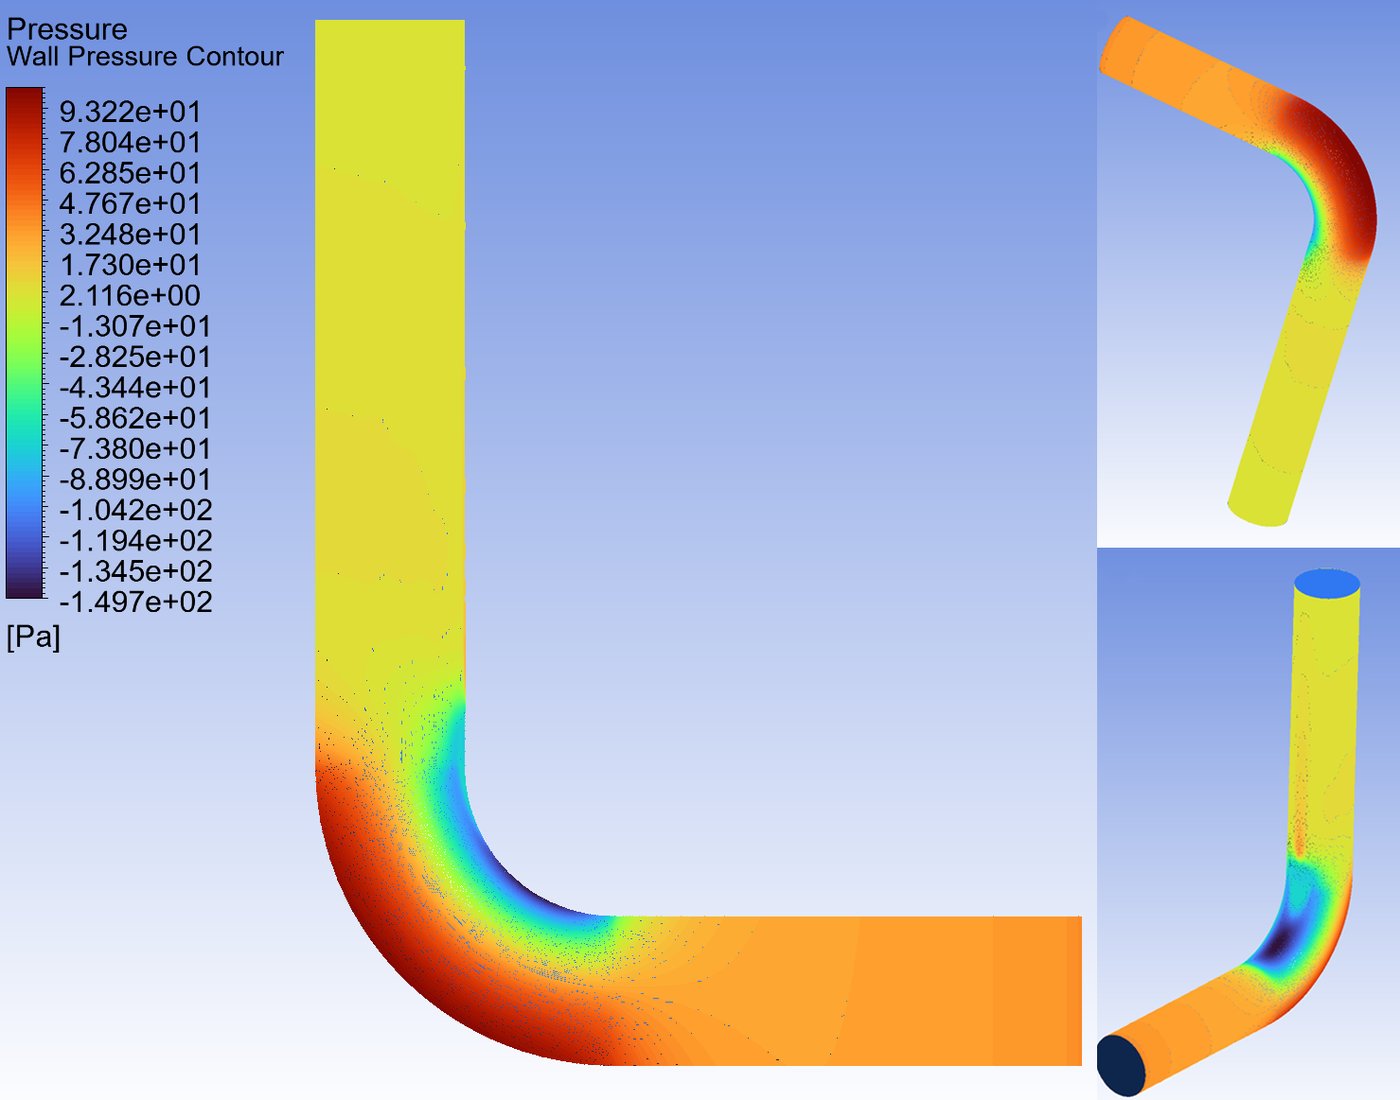
Six independent results point to the same finding
Wall and interior pressure, wall shear stress, turbulent kinetic energy, streamline topology, and helicity at two downstream stations all converge on one conclusion: the elbow generates a persistent secondary (Dean-vortex) flow that does not fully die out within the 8 m downstream leg. Peak wall pressure and peak wall shear also coincide at the same location, the outer wall at the bend entrance, which flags that specific point as the one to consider for a wear-resistant liner in abrasive, dust-laden service.
Structural analysis (FEA)
The elbow and its adjoining straight stubs, idealized as a shell from the CAD solid, were checked under two load cases: the uniform system design pressure, and the CFD's own resolved, non-uniform wall-pressure field.
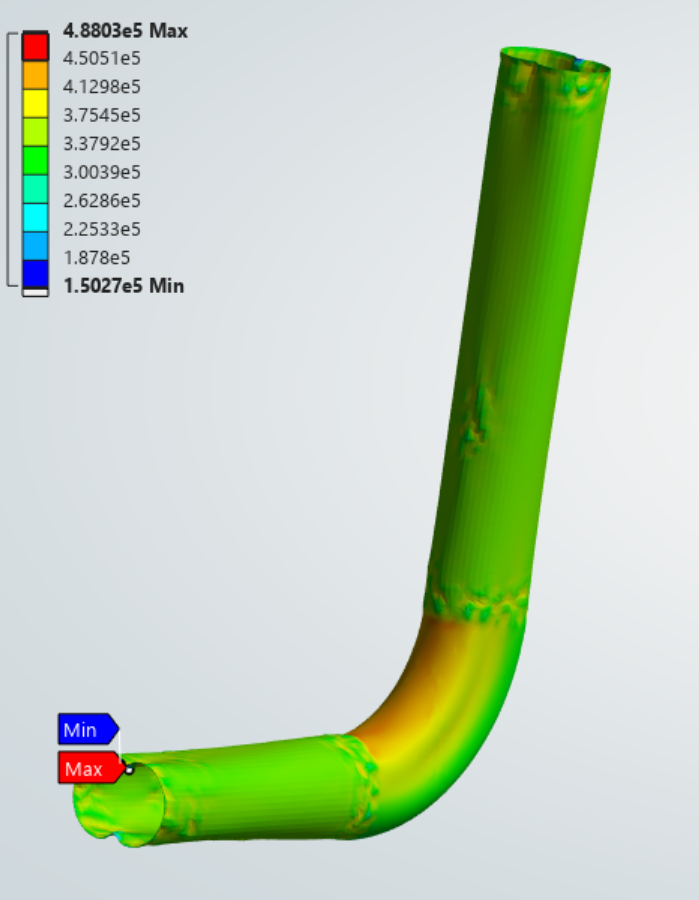
Uniform Design Pressure
The elbow and adjoining straight stubs, idealized as a shell from the SolidWorks solid, are loaded with the uniform −3.0 kPa system design pressure used to size the duct wall in the design basis.
Stress stays well below yield everywhere. A separate local maximum at the model’s cut edges is a known artifact of the simplified boundary condition there, confirmed by probing the elbow directly rather than reading the raw global maximum.
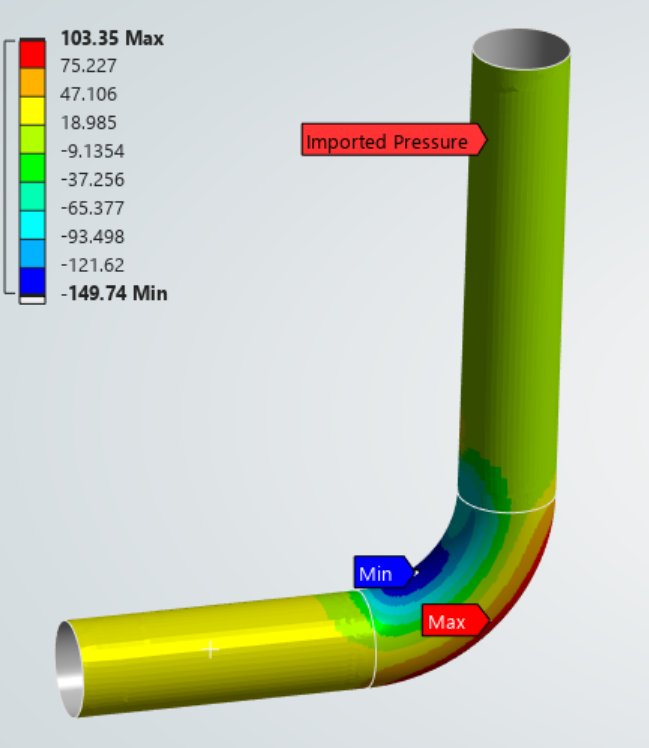
CFD-Resolved Pressure
The same elbow is reloaded with the CFD’s own converged, spatially non-uniform wall-pressure field (Fig. 7) in place of the uniform assumption, on top of the system design pressure. On import, the field’s minimum matched the CFD’s own minimum almost exactly (−149.74 Pa vs. −149.7 Pa).
The realistic load redistributes stress rather than raising it: elevated at the outer wall, relieved at the inner wall, tracing directly to the bend’s flow asymmetry from Section 06. The verdict does not change, but the result is now a physically explained one rather than an assumed one.
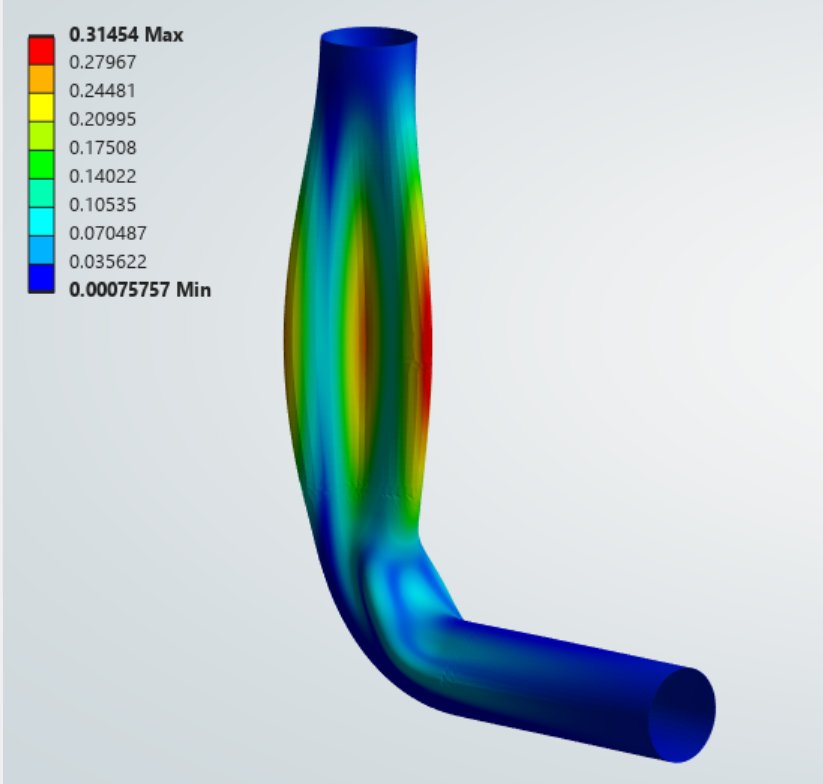
Buckling Check (Governing Failure Mode)
Yielding carries an overwhelming margin in both load cases, so buckling under external (suction) pressure, identified as the governing mode from the very first hand calculation in the design basis, is the check that actually sizes this duct.
This is an idealized linear eigenvalue result, not a pressure the real shell can be assumed to reach. Real thin shells buckle at a lower pressure once fabrication imperfections are present, which is exactly why the design basis itself uplifted its target safety factor from a baseline of 3 to 4 for this duct’s field-rolled, site-welded construction. Even a substantial, conservative derating for imperfection sensitivity leaves a margin of roughly 15–17, still comfortably above that target of 4.
Integration and specification check
The two analysis phases connect directly: the realistic load case in Section 07 is the CFD's own converged wall pressure, carried into the structural model. The finished study was then checked back against its own starting specification, item by item.
- 1Standards basis: ISO/EN used throughout wherever an equivalent exists (ISO 7005-1, EN 10025-2, ISO 898-1, EN 13445-3).Satisfied
- 2Traceability: every numeric input tagged back to a cited reference or a stated assumption.Satisfied
- 3Verification: every CFD and FEA result checked against independent hand calculation.Satisfied
- 4Project discipline: single representative geometry, isothermal, single-phase, as scoped at the outset.Satisfied
- 5Reusability: built on general, parametric formulas rather than hard-coded numbers, so the same workflow rescales to a different duct.Satisfied
Engineering judgment & recommendations
Beyond the pass/fail result, the study surfaces where a shortcut would have gone wrong, and what to check next.
⚠ Check diameter-dependence before trusting a generic K-factor
A textbook elbow loss coefficient looked like a CFD discrepancy until it was traced to the table’s own small-pipe basis. Worth carrying into any future large-diameter ductwork: check a generic coefficient’s stated range before applying it, rather than after.
Erosion risk now has a specific location
Peak wall pressure and peak wall shear coincide at the outer wall, bend entrance. For hot, dust-laden service, that is the natural place to specify a wear-resistant liner or added wall allowance in a production design.
Buckling governs by a wide margin, yielding does not
With a buckling SF of roughly 35 (still 15–17 after a conservative imperfection derating) against a target of 4, and a yield SF over 500, future duct sizing on this line can treat external-pressure buckling as the controlling check from the outset.
Two checks recommended before production
A dedicated FEA mesh-convergence study, mirroring the CFD phase’s base-versus-refined comparison, and a thermal-loading pass at the 200°C operating temperature, deferred here on the internship’s time budget, are the two clearest next steps.